
")
The extent of ice coverage is an important parameter because ice reflects approximately 35% of incident sunlight, while water reflects only ca. 7%.
Arctic sea ice coverage has been diminishing since it is measured, as shown above.
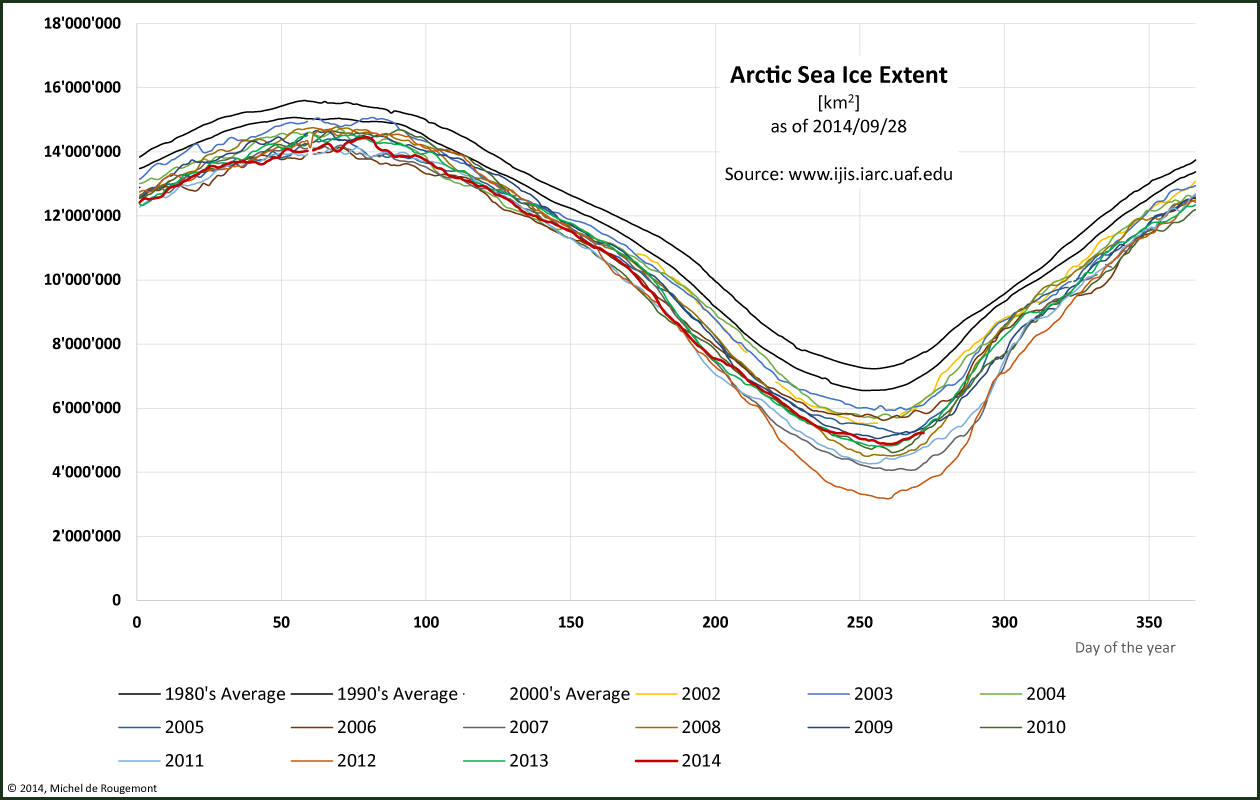
Arctic Sea Ice Extent with sea ice concentration > 15% as of Sep. 28, 2014
Source: IARC-JAXA Information System (IJIS)
Greenland is the second largest emerged area covered by ice. From a total of 2.6 million Gt (or 2’850’000 km3) ice mass, it is receding by 260 Gt a-1 (-0.01%per year). At this rate it may take 10’000 years to melt it all.
For the Antarctic ice sheet, a mass balance over 19 years indicates a net loss of -71 ± 53 Gt a-1 from a total of 26.92 million Gt. At this rate the total melting would take place in 380’000 years.
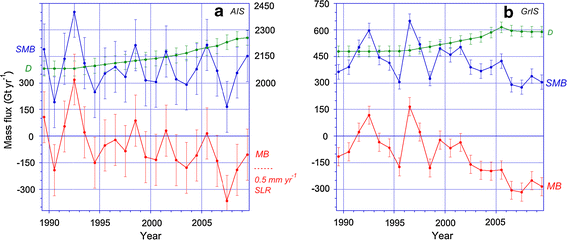
Time series of surface mass balance (SMB, blue), solid ice discharge (D, green) and ice sheet mass balance (MB, red) for the Antarctic Ice Sheet (AIS, left) and the Greenland Ice Sheet (GrIS, right) in Gt/a.
For the AIS (left), scale for SMB and D has been shifted (right ordinate) to allow plotting on the same scale as for the GrIS (right). D is assumed constant before 1992.
Source: link.springer.com/article/10.1007/s10712-011-9137-z/fulltext.html
Heat release and absorption takes place in the form if ice crystallisation and melting, with a latent heat of 334 kJ kg-1. The present melting rate of both ice sheets corresponds to a heat flux of 3500 GW, or 0.010 W m-2 of the total ocean surface.
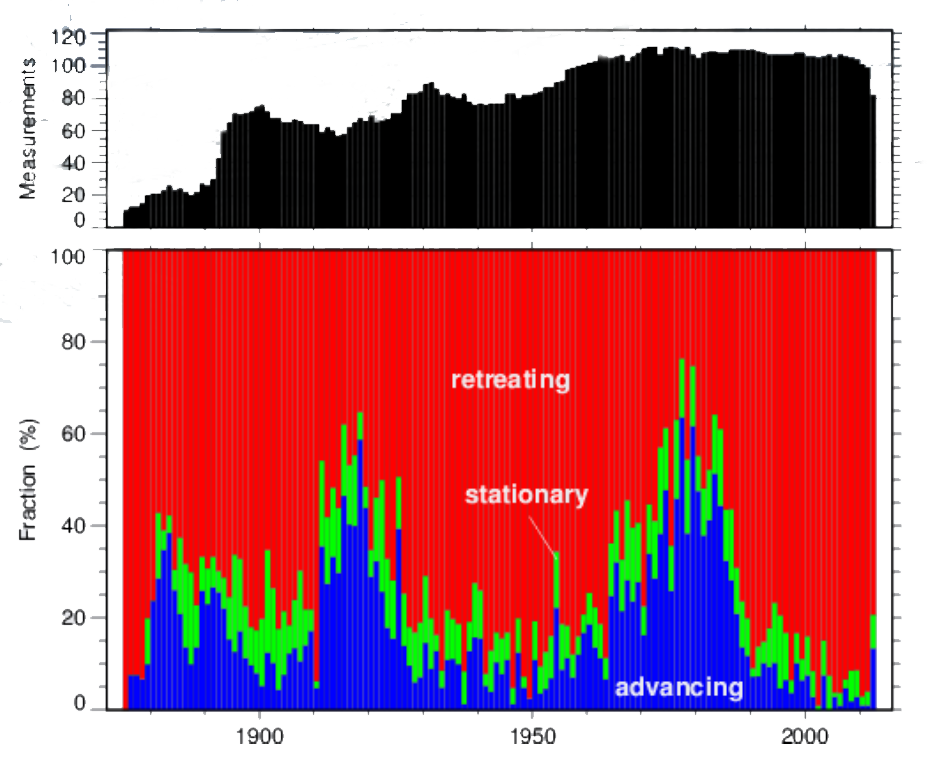
Other glaciers are globally in retreat in the Alps, in the Himalya, in South and North America. While the implied water volume is not as large as for Greenland or the Antarctica, it constitutes an important stock of fresh water for agriculture and human consumption in the corresponding drainage basins.
Example from the Swiss Alps:
Swiss glacier length variation. Note the periods of growth and retreat that are not
necessarily in phase with observed temperature evolution. Source: glaciology.ethz.ch
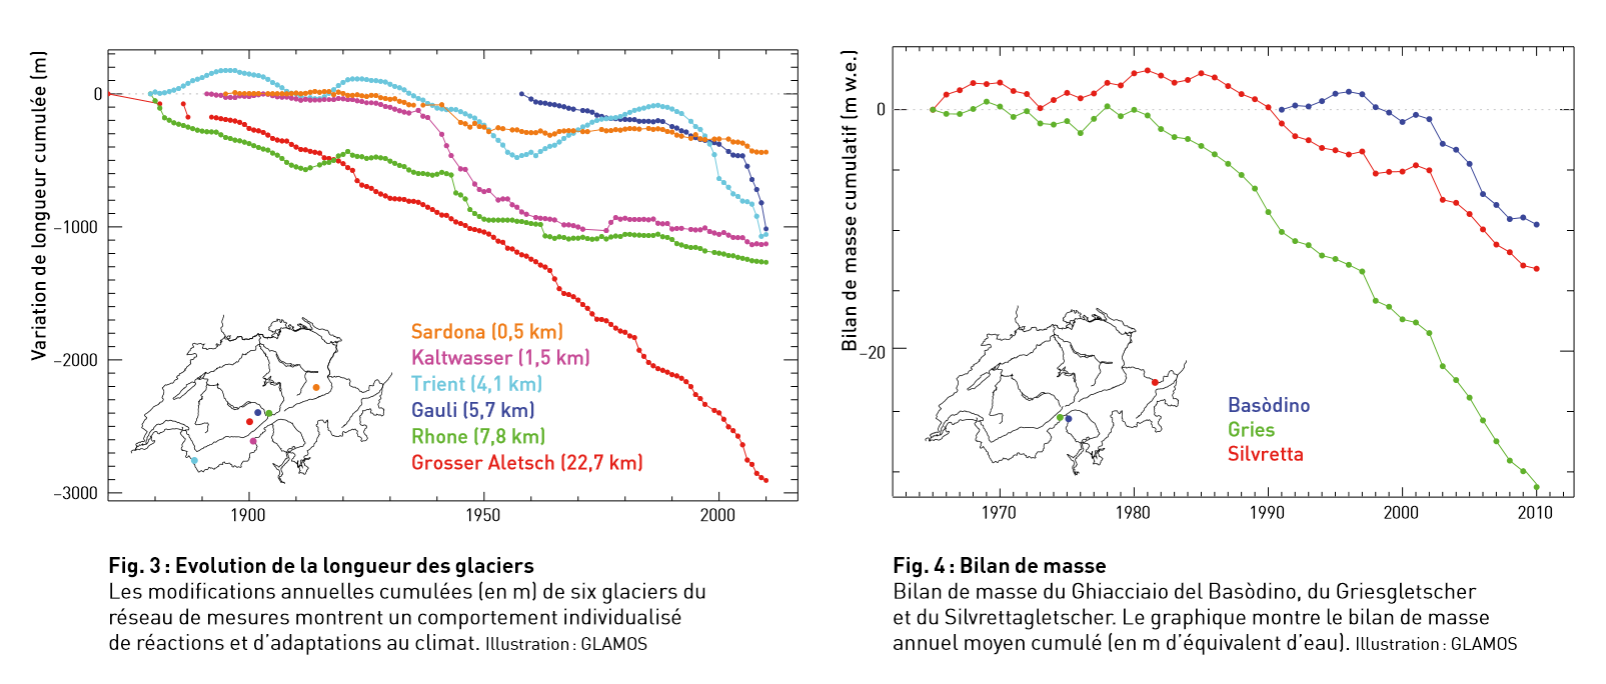
Length and mass balance of selected Swiss glaciers
Source: Frank Paul et al, Les Alpes, juillet 2011.
Ice sheet coverage and, correspondingly, sea level for the past 3 million years have been reconstructed by Bintanja and van de Wal[1]:
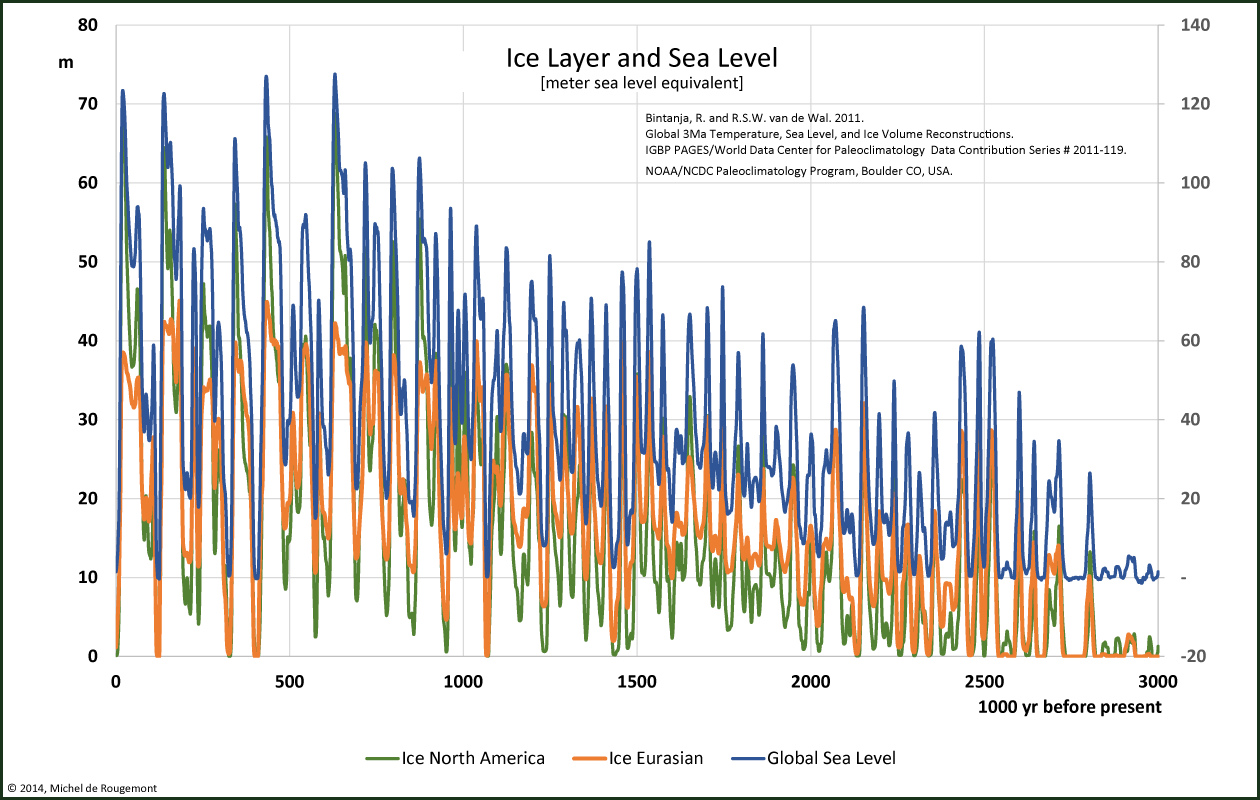
Ice sheet and sea level reconstruction over the past 3 million years.
(The sea level is inversed to get everything on a positive diagram)
One full Milankovitch cycle is represented with this zoom over the past 150’000 years:
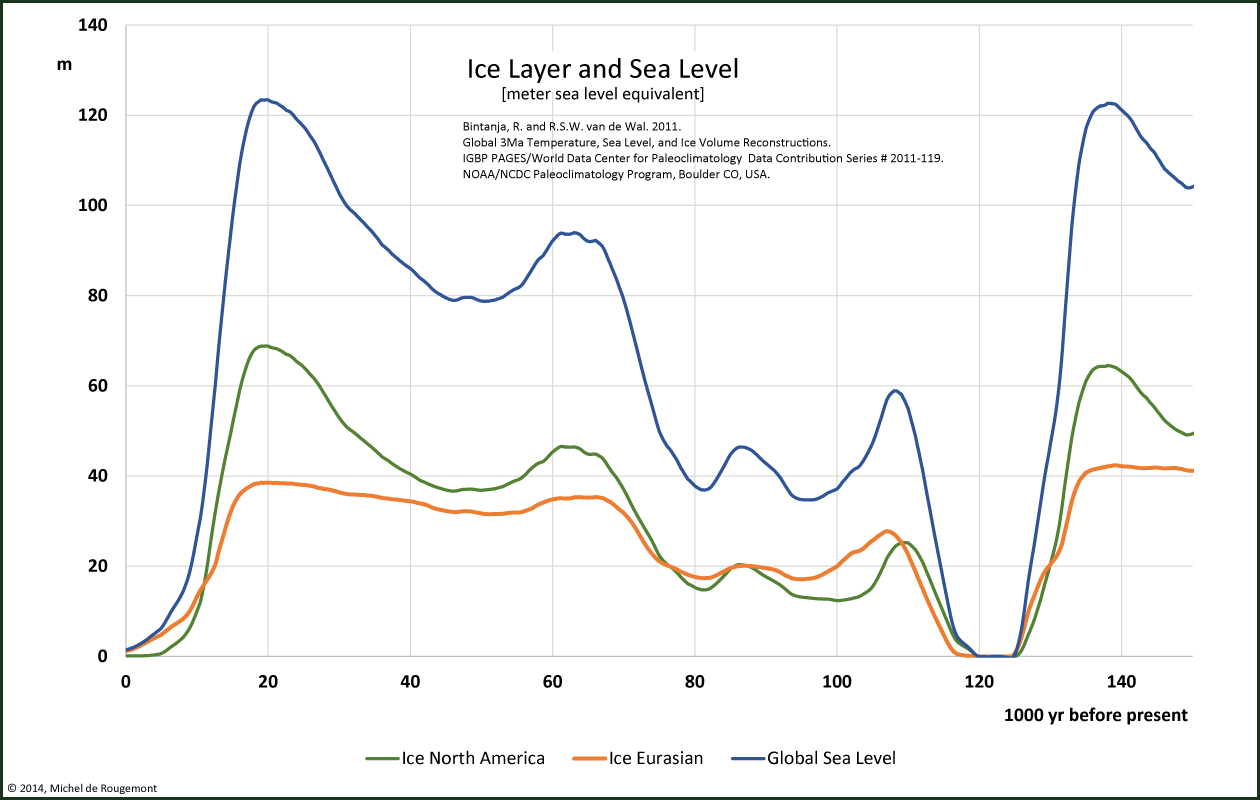
Ice sheet and sea level reconstruction over past 150'000 years
Temperature variations are also associated with these changes; they are orders of magnitude larger than the current wobbles.
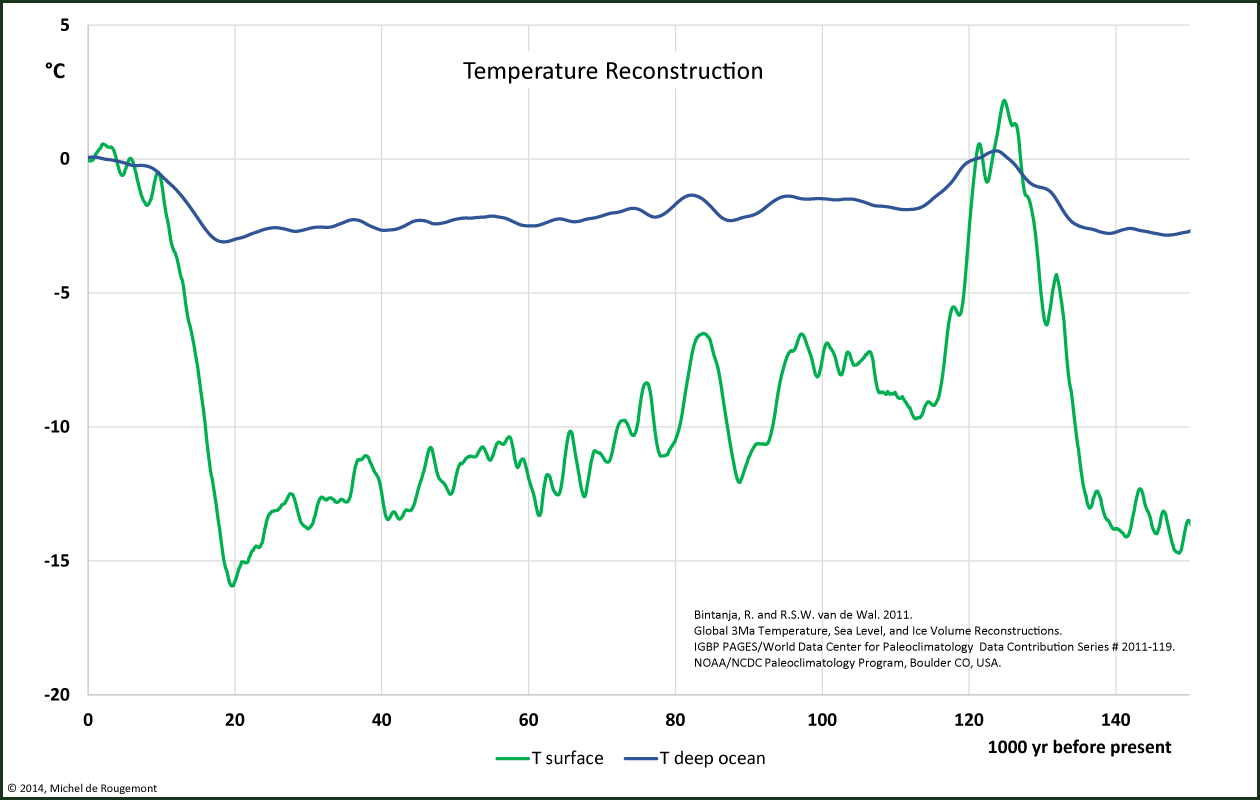
Temperature reconstruction over the past 150'000 years at the Earth surface and in deep ocean.
Note the beginning of the end of the last glaciation, 10-12’000 years ago.
Oceans and ice sheets capture large amounts of heat that can be accumulated, and released, over long periods of time. On the short term however, it is almost impossible to deduce from imprecise variations that steady climate changes are going-on since sufficient statistically significant data series are not available.
[1] Bintanja, R. and R.S.W. van de Wal. 2011.
Global 3Ma Temperature, Sea Level, and Ice Volume Reconstructions.
IGBP PAGES/World Data Center for Paleoclimatology Data Contribution Series # 2011-119.
NOAA/NCDC Paleoclimatology Program, Boulder CO, USA