
")
Data series of dependent variables must be available in sufficient quantity to investigate if a significant[1] correlation may exist between them. Obviously, it will be a waste of time to seek a correlation between parameters that are already linked together by valid physical theories.
To establish a correlation, the internal functions of the system must not be known. They can be taken as a black box. However, at the moment of interpreting an alleged correlation it becomes necessary to evaluate its logics and its plausibility. For example it will be easy to demonstrate that leaves are falling from the trees when oil and gas are consumed for heating houses. But we readily understand without splitting hairs that human activity is not the cause of falling leaves. This means that correlation does not imply causation, although it may.
This precaution taken, let’s try to examine certain correlations between data shown in Chapter 1.
All evaluations presented here were made with the software Eureka, available at www.nutonian.com (a free trial period of 30 days gives time for a lot of interesting work, and a license for non-commercial use costs 200 US dollars for one year).
Greenhouse gas concentration and human carbon emissions
As seen in Figure 18, both atmospheric CO2 concentration and cumulated carbon emissions since the BIE follow a similar rising pattern.
It was not surprising, at least for “non-deniers”, that an excellent correlation was found:
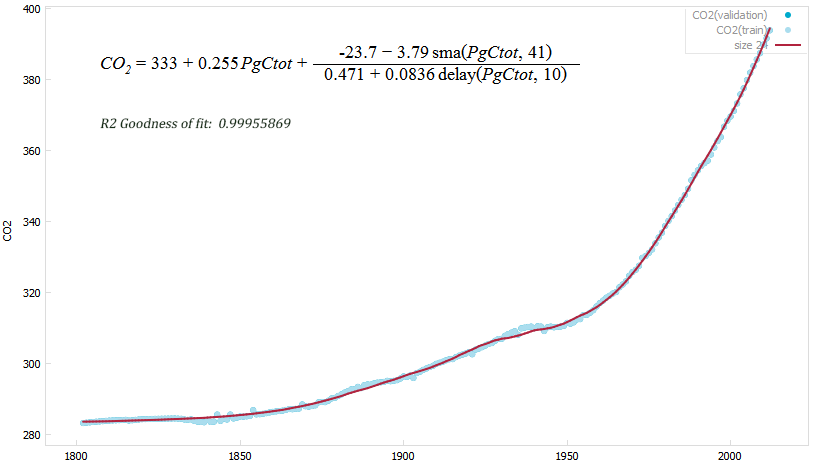
Correlation between CO2 concentration (ppm) and cumulated carbon emissions (PgCtot)
Blue dots: actual concentration. Red line: calculated concentration.
Data provided at yearly intervals (delay and smoothing in the formula)
A more practical regression formula is useful for recent years (since 1950, with a R2 goodness of fit of “only” 0.999):
PPM = 2371.1 -15597921 / (7509.4 + PgC)
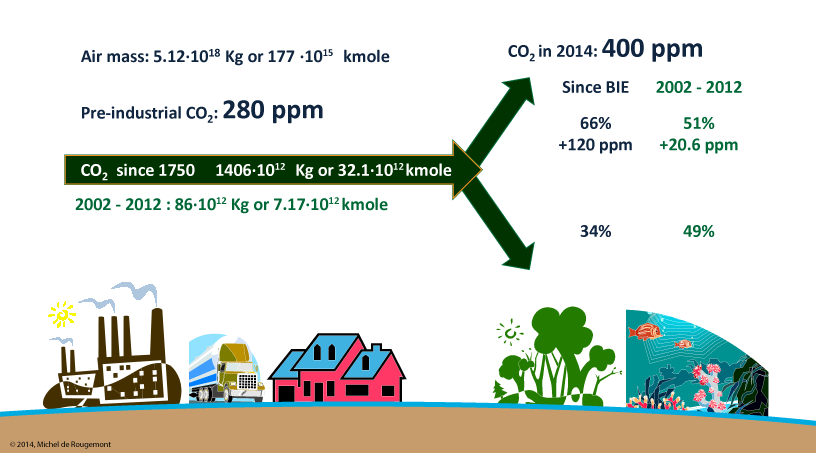
Thus there is a high confidence that a linear relationship ties the atmospheric concentration of carbon dioxide with the cumulated carbon emissions by human activities: for each petagram of carbon emitted (currently ~10 per year) 0.263 ppm CO2 will be found in the atmosphere.
A balance around the atmosphere can be drawn:
Methane and Nitrous oxide
Aside of water and CO2, the major contributors to the class of greenhouse gases are methane and nitrous oxide.
Since nitrous oxide is a reaction by-product of combustion and of the presence of VOCs in the atmosphere, a correlation may be found between its concentration and those of CO2 and methane. The following formula is obtained with an excellent goodness of fit:
N2Ocalc = 157.57 + 0.38962· CO2 + 0.0078776· CH4 (regression with R2 = 0.999)
This regression is seen on this chart:
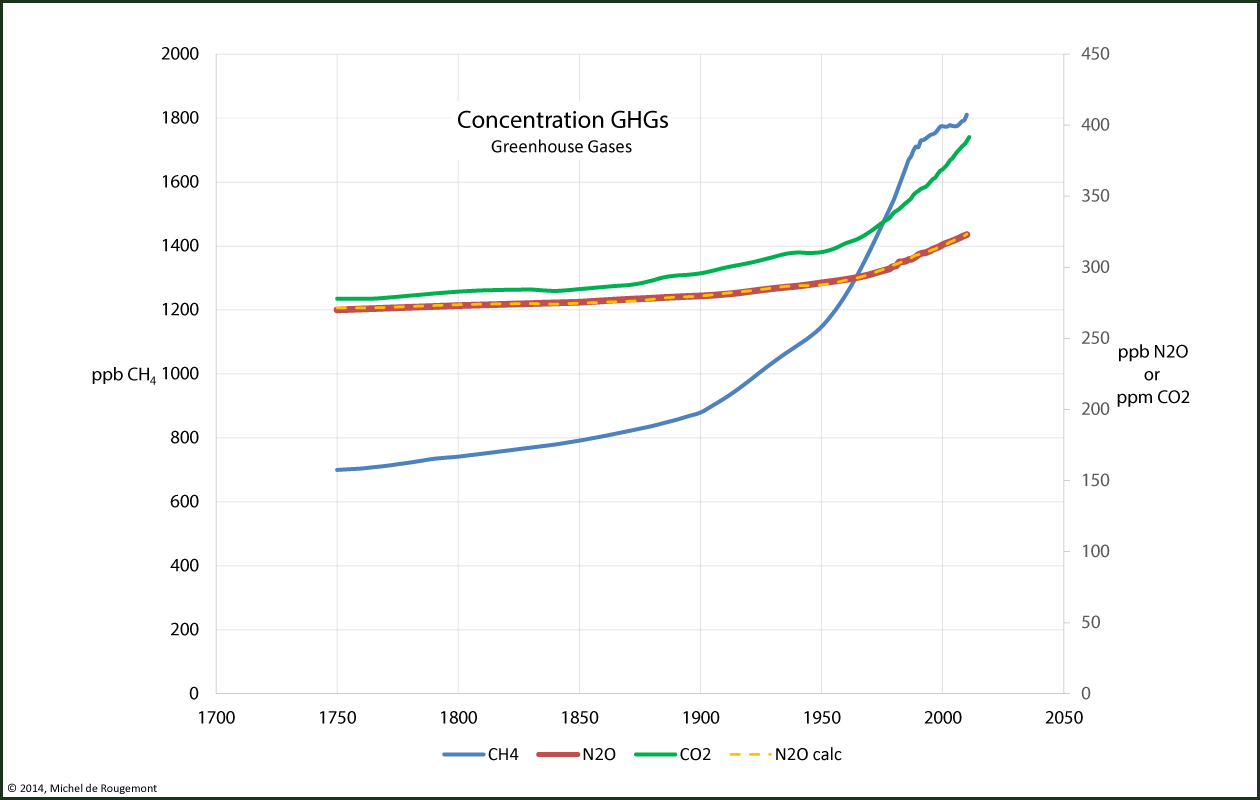
Concentration of greenhouse gases and regression N2Ocalc = f(CO2,CH4)
Data source: European Environmental Agency, from CDIAC.
[1] Significant: not attributable to randomness.