Forcings due to GHGs can be calculated from their concentrations with the formula proposed by Myrhe:

Radiative forcing calculated with Myhre’s formulas based on absorption
of long wave (IR) radiation.
When using the same scenarios for future development as described in chapter 3.1.2:
and assuming that methane and nitrous oxide will continue developing in parallel with the CO2 rise rate, the following picture can be obtained.

Past and future surface temperature evaluation.
In this complicated chart, the warming as observed and extrapolated is compared with the warming that can be attributed to the known greenhouse gases, taking into account the feedbacks discussed in the past chapter. The same data can be presented in a table form.
|
As of today (2014), compared to pre-industrial era |
Additional warming between today and 2047[1] |
||||||
|
ΔT observed overall |
ΔT due to all GHGs |
ΔT due to CO2 only |
ΔT not explained |
ΔT extra-polated overall |
ΔT due to all GHGs |
ΔT due to CO2 only |
|
|
Scenario A |
0.98 °C |
0.39 °C |
0.28 °C |
0.59 °C |
0.40 |
0.21 |
0.19 |
|
Scenario B |
0.59 |
0.31 |
0.28 |
||||
|
Scenario C |
0.37 |
0.16 |
0.14 |
||||
|
Scenario K |
0.20 |
0.11 |
0.10 |
||||
Warming observed, extrapolated from observation, and calculated from radiative forcing according to Myhre’s formulas.
Average feedback factor λ=-1.59 K W-1 m2 applied.
In this table, “ΔT not explained” is the difference between the observed warming and the one that can be attributed to GHGs only.
To produce the not explained 0.59 °C, an additional primary forcing of 2.91 W m-2 must be caused by something that has not yet been identified.
In other words, radiative forcing by GHGs cannot explain 60% of the observed warming since the BIE.
To fill the gap, one may be tempted to tune the model, and to apply a large positive feedback factor λ to the whole system, somehow to force the forcing; but this would imply λ = +2.3 K W-1 m2 with which the stability of the climate system would be critically low, which is in full contradiction with earth’s geological history and with its resilience observed after significant disturbances such as volcanic eruptions, and tropical cyclones. And – last but not least – such a high positive feedback would be in full contradiction with all of the published feedback parameters reviewed by IPCC. Therefore, causes other than radiative forcing by GHGs must be found, naturally occurring or man-made[2].
Beginning with the industrial era or continuing the exit from the little ice age, these other factors must show a steady growth pattern up to the present time. Only conjectures can be made, since no other useful observation data is available – if it would be the case, I would have incorporated it in the correlation analysis.
Man-made possible factors with steady growth pattern are:
However, in IPCC’s 5th report these effects (aside of black carbon) are deemed to be of low magnitude and rather in the cooling than in the warming direction, as summarized in the nearby figure. |
|
Naturally occurring phenomena with steady growth pattern can be:
Solar impact does not consist only of thermal effects due to electromagnetic radiation in the UV-Vis-IR range. Complex chemical reactions are also induced at altitude as well as at the ground (photosynthesis) that can lead to enhanced or reduced aerosol or cloud formation.
The Cosmics Leaving Outdoor Droplets (CLOUD) experiment at the CERN (cloud.web.cern.ch) studies the influence of cosmic rays on water droplet nucleation to form clouds in presence of aerosols; it is still underway. The link to a potential climate response is far from being quantified.
Regarding clouds and cloud formation, current knowledge is quite scarce. With +0.54 °C per percent cloudiness, the model sensitivity is quite significant. In a previous report, IPCC dared showing how inaccurate observations and models are:
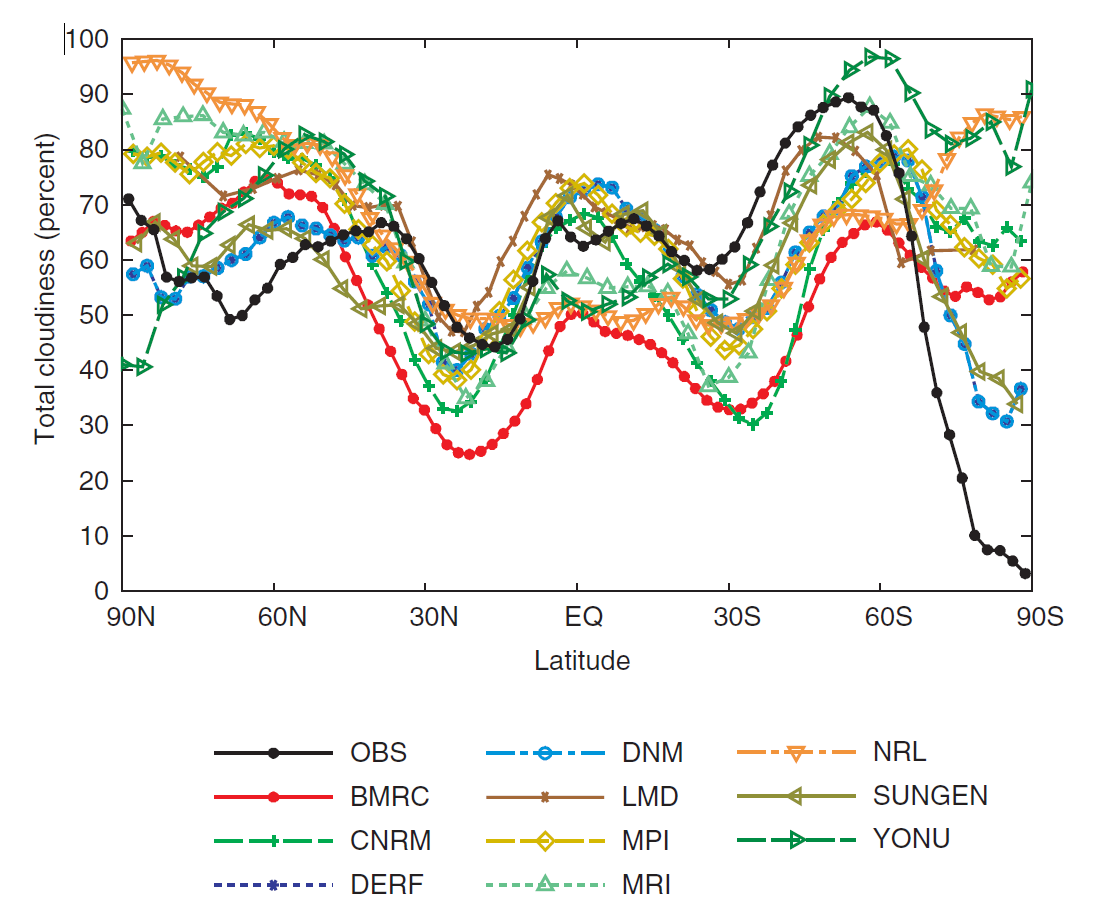
Cloudiness December – February, as observed and evaluated by 11 models
Source: IPCC 2001 assessment report, chapter 8.
Note: the sensitivity of surface temperature to cloudiness is + 0.5 °C for a cloudiness increase by 1 percent.
Other possible interactions with solar activity are shown in the following scheme.
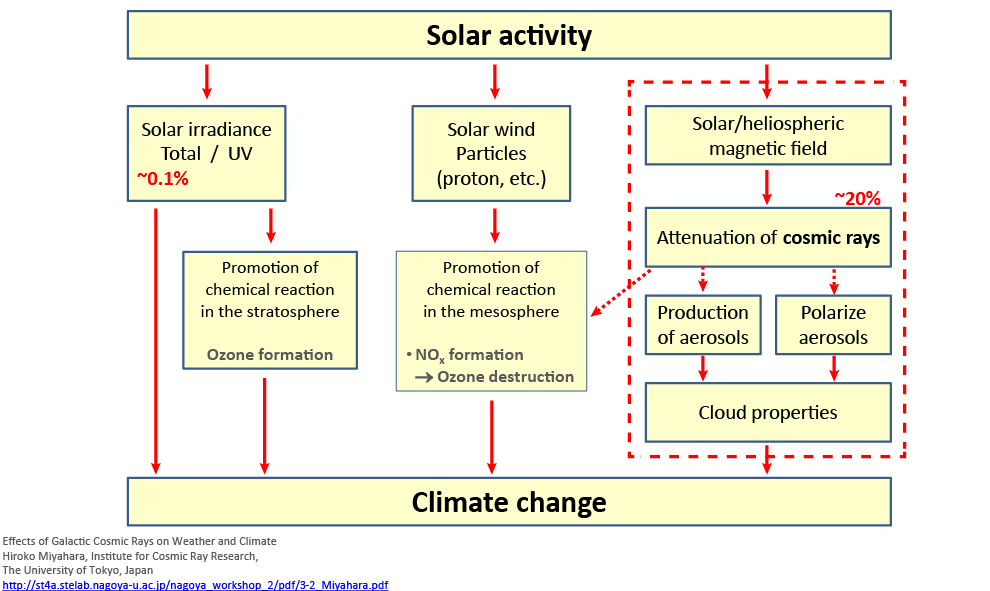
Possible mechanism of solar influence
Source: http://st4a.stelab.nagoya-u.ac.jp/nagoya_workshop_2/pdf/3-2_Miyahara.pdf
This is an area of high awareness but on which little is known about.
This would stay in contradiction with the latest IPCC’s assessment that it is virtually certain (IPCC 5th report) that the upper layer of the oceans has warmed since the BIE, thus not cooled by releasing stored energy.
However, we shall remember that a layer of only 3.4 m has the same heat capacity as the whole atmosphere, and that evaporation involves huge amounts of energy in adiabatic or isothermal conditions. Considering the whole ocean, an accurate time dependent enthalpy balance is yet to be established and validated.
A mix of these phenomena – and others not invented here – may well fill the 2.9 W m‑2 forcing gap.
In any case, to attribute all ills – if any – to the carbon dioxide molecule appears to be an oversimplification and an exaggeration.
From the calculations presented here it is possible to show what differences could be achieved in 2047 or at the end of this century according to the chosen scenario. Some important findings:
[1] One could be tempted to ask “why 20147 ?“, and the answer being “guess why!”
[2] Women also. The reader is gently asked to consider that in this present text the masculine may, but has not to, mean the feminine, and vice versa. Grammar has no concern for equality, however it is useful to [try to] follow its rules.
[3] Bond, T. C., et al. (2013), Bounding the role of black carbon in the climate system: A scientific assessment, J. Geophys. Res. Atmos., 118, 5380–5552, doi:10.1002/jgrd.50171.